
MAR 17 - Introducing Group Analytics
While 360-degree feedback is a powerful tool to develop Leadership competencies in an organization, the data gathered through the 360-degree survey process across management levels and the organization is too valuable to be ignored. We have launched the first phase of SelfStir Business Analytics to help organizations answer key questions relating to the group of people carrying out multi-rater feedback in the organization.
Dashboard

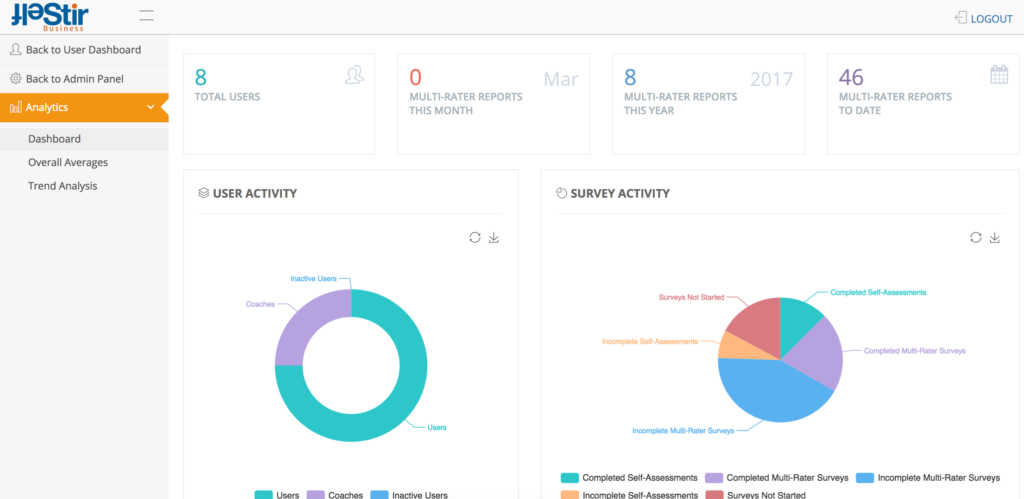
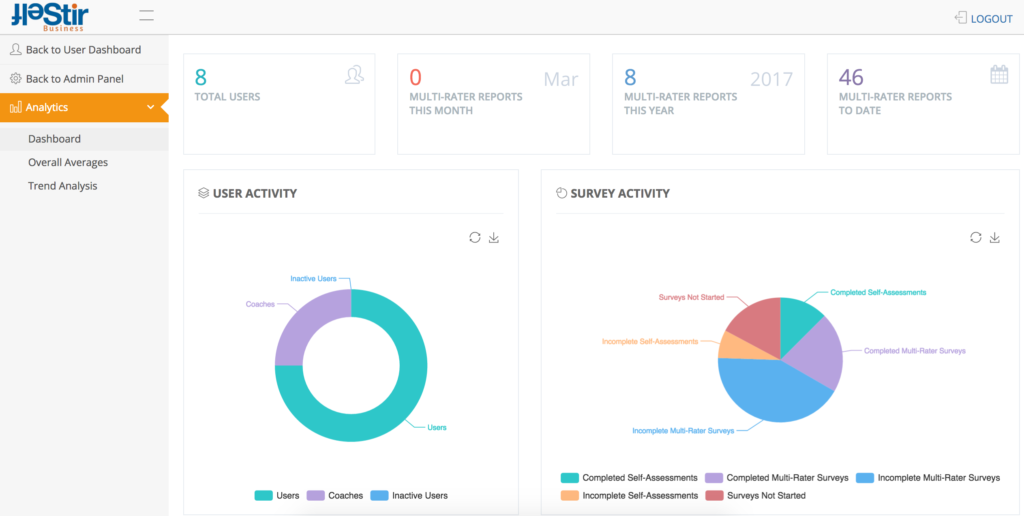
We designed a visual representation of the User Activity in the Admin Panel, which can quickly show bottlenecks and other hindrances to a successful administration and execution of a 360-degree feedback campaign or ongoing feedback initiatives in the organization.
Questions Answered:
- Are people carrying out feedback as required?
- Are raters responding to filling out the questionnaires?
- Are rater invitation emails being successfully sent?
- Are people using their journal?
- Are people setting action items?
- Are people contributing to the recommendations list or the discussion board?
Overall Competency Averages

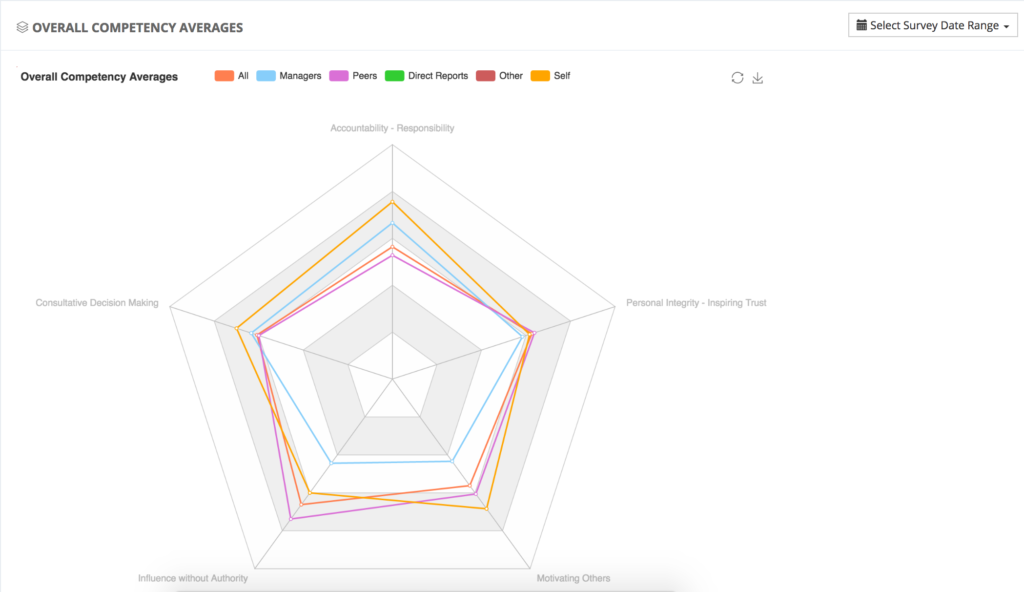
While there are people who do not find spider graphs easy to analyze, this visualization style makes it easy to spot training and development needs across levels of the organization by each competency. This graph is also powerful for noticing hierarchical disconnects between levels of the organization. Ie. Peers rating each other, direct reports rating their managers, managers rating their direct reports and/or external clients rating the employees. It is also a great tool in assessing the strength of the corporate culture when competencies are selected to represent the values/behaviors of the corporate culture. Interventions to help develop those values will be easy to justify and get the buy-in from not only from the leadership team but also by the whole organization. The date filter will be most helpful when creating annual, bi-annual or quarterly reports, showing trends relating to: training strategy, ROI, recruitment strategy, culture development, leadership development, etc.
Questions Answered:
- How is the organization doing overall based on our competency model?
- How do managers perceive their direct reports in general?
- How do direct reports perceive their managers in general?
- How do peers perceive each other in general?
- What are the competencies that are very strong in our organization?
- What are the competencies that are very weak in our organization?
- What areas of training and development do we need?
- Do we meet the minimum rating for the competencies that represent the organizational values? Which values do we need to build further?
- What type of people do we need to hire?
Trend Analysis

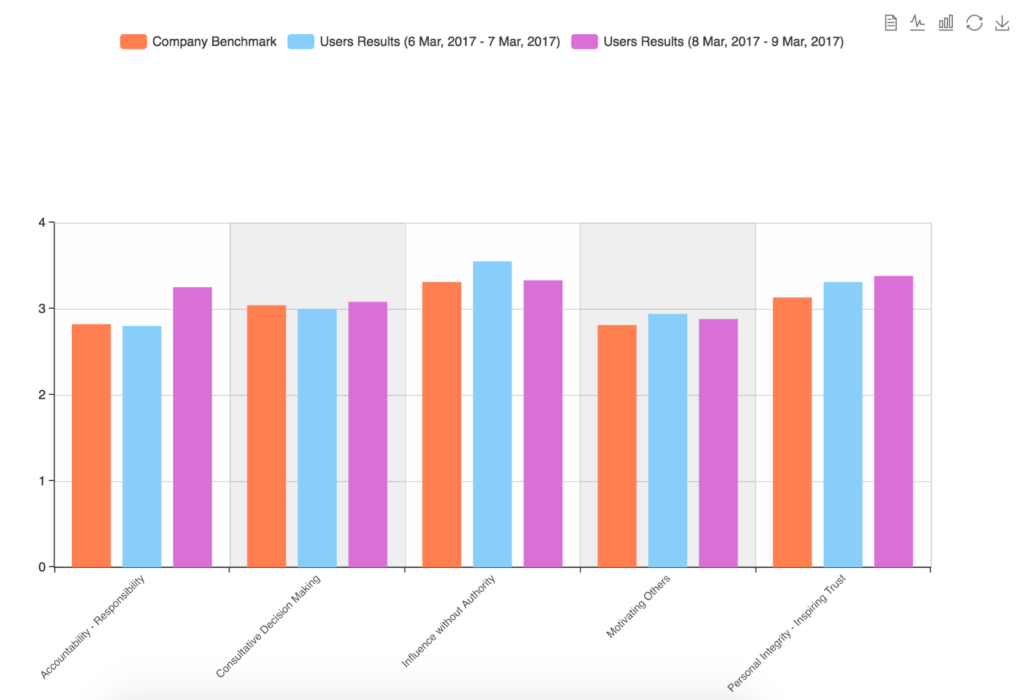
The trend analysis visual tool and filter has been designed to provide you with the ability to drill further down into the group analytics. The analytics tool provides the ability to compare results from different time frames allowing you to see trends across months, years or any time frame comparisons, while continuously showing the company benchmark results in real time. The most powerful aspect of this tool is the ability to drill down in the trend analysis to see results of an individual or by a group of individuals eg. by level or by department or by team. This analysis will show an upward or downward movement per competency scores over time.
Questions Answered:
- Has the organization improved since last year?
- Has a certain training program for a certain competency made a difference in people’s scores since we launched the program?
- How is the new team leader doing in his/her new role compared to his/her last role?
- Has the department intervention helped improve people’s skills in that department?
- How does our top management compare in terms of leadership competencies with the rest of the organization?
- Who are our hidden leaders that need to be surfaced?
- Do individuals in our succession plan have the right competencies for the role? What areas do they need development in?
- What should executive coaches focus on when working with our executive team?